Using influxDB with Sitecore Part 2

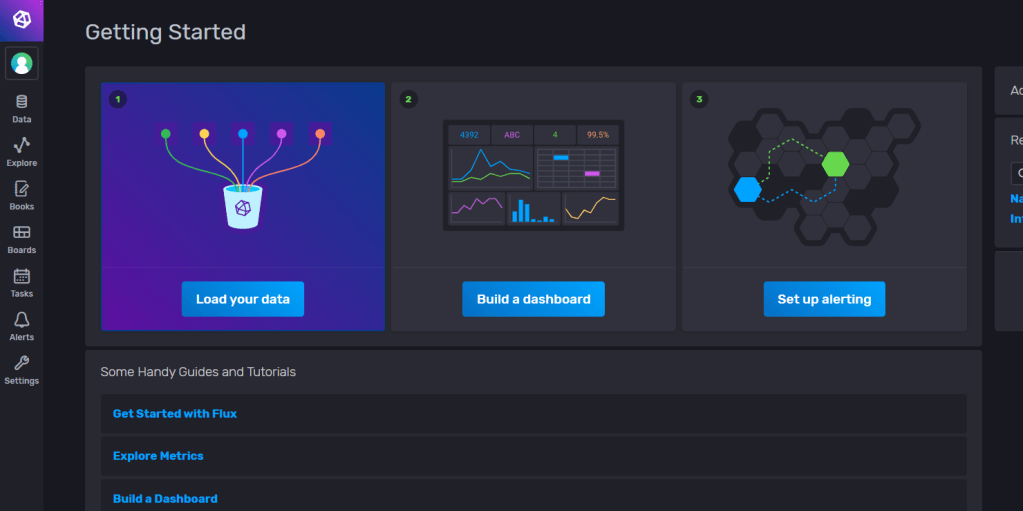
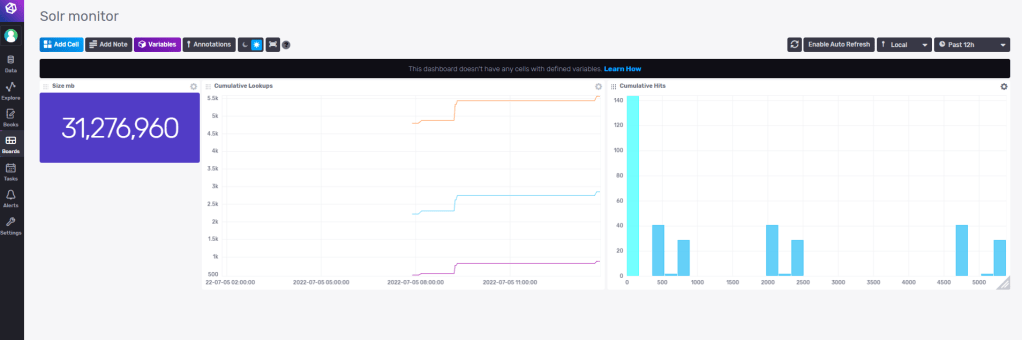
This is a continuation of Part 1 where I go over how to setup influxdb to monitor Solr. If you haven’t read it and are looking for installation guides for influx, check out part 1 here

In this PART 2 I want to setup some basic statistics for when visitors hit a 404 or a 500 page and showcase the influxDB C# client. We’ll see how we can present the data in InfluxDB at the end. To try and cut down this post a bit I’ll make some assumptions: That you can setup your own pipelines and processors to start the execution of your code at the correct place.

The influxDB C# client only supports .NET Core so you can setup a separate API service that your Sitecore application can use to Write and Get the data.

  1. I’ll show how we can write data to influxDB through code.
  2. We’ll look at getting data from influxDB through code.


1. Write data to InfluxDB

Here we can write some data to our influxDB bucket by code, keeping it simple:

using InfluxDB.Client;
using InfluxDB.Client.Api.Domain;
using InfluxDB.Client.Core;

...

const string token = "<TOKEN>";
const string bucket = "errorbucket";
const string org = "myOrg";

var client = InfluxDBClientFactory.Create("http://localhost:8086", token);

var 500error = new ErrorPage { Type = "500", Hit = 1, Time = DateTime.UtcNow };
var 404error = new ErrorPage { Type = "404", Hit = 1, Time = DateTime.UtcNow };

using (var writeApi = client.GetWriteApi())
{
   if(errorCause == 500)
      writeApi.WriteMeasurement(500error, WritePrecision.Ns, bucket, org);
    
   if(errorCause == 404)
      writeApi.WriteMeasurement(404error, WritePrecision.Ns, bucket, org);
}

[Measurement("error_page")]
public class ErrorPage
{
    [Column("type", IsTag = true)] public string Type { get; set; }
    [Column("hit")] public int? Hit { get; set; }
    [Column(IsTimestamp = true)] public DateTime Time { get; set; }
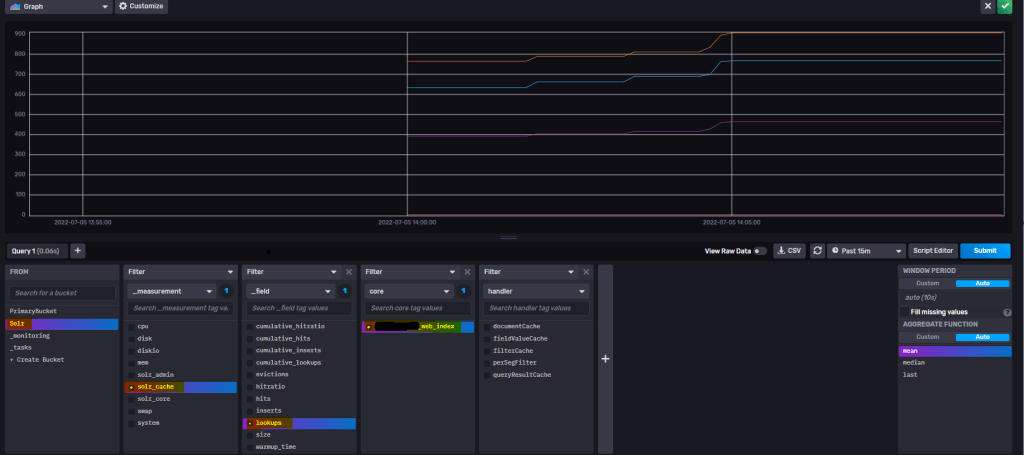
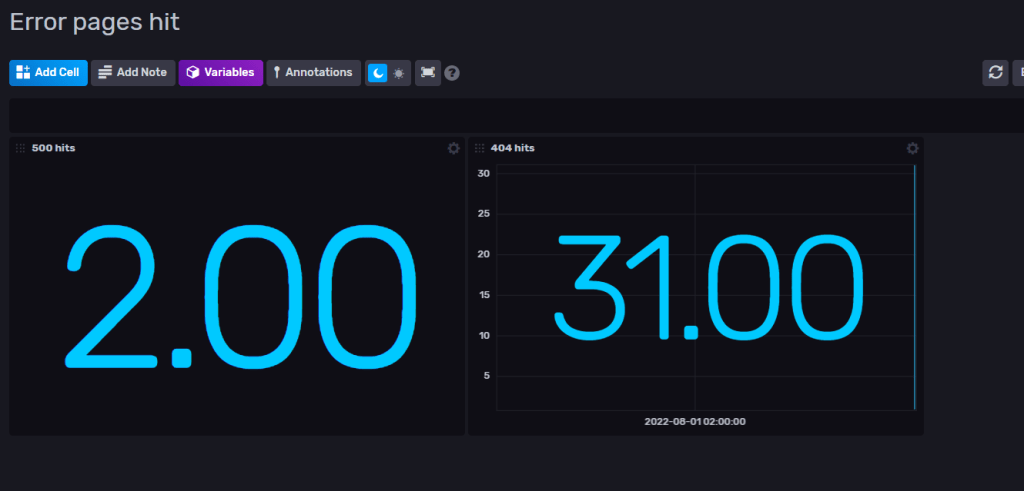
}

Now we got some data in InfluxDB that we can show in a dashboard ( see Part 1 on how to setup dashboard)

Sample data

2. Get – Query data

A simple method to get the hit count for 404 pages. This will simply return 31 if we go by the data from above. Change the “type” to 500 to get the count for that one etc.

public async Task<int> Get404Hits()
{
    var fluxQuery = "from(bucket: \"errorbucket\") " +
                    "|> range(start: -1d)" +
                    "|> filter(fn: (r) => r[\"_measurement\"] == \"error_page\")" +
                    "|> filter(fn: (r) => r[\"_field\"] == \"hit\")" +
                    "|> filter(fn: (r) => r[\"type\"] == \"404\")" +
                    "|> cumulativeSum(columns: [\"_value\"])";

    var result = await client.GetQueryApi().QueryAsync<int>(fluxQuery, org);

    return result.Count;
}

Now you can write and query data in C# with InfluxDB.
You can for example create your own graph to present inside Sitecore or use the dashboard in InfluxDB.

Thanks for reading and hope you get some usage with InfluxDB. I’m still learning and I see a lot of fun stuff ahead with this tool.

Using InfluxDB for monitoring Sitecore’s Solr PART 1

Heard of InfluxDB before and what is it used for?

InfluxDB is an open-source time series database (TSDB) developed by the company InfluxData. It is written for storage and retrieval of time series data in fields such as operations monitoring, application metrics, Internet of Things sensor data, and real-time analytics.”
Wiki

So it’s a perfect tool to save a bunch of data and use in fancy graphs or diagrams (or excel…). I for one love this.

So how can we use this with Sitecore?

In this first part i’ll show how we can monitor our Sitecore’s Solr instance and use the graph dashboard built-in for InfluxDB. In a later part I will show how we can query or write to influxDB for data and present it in Sitecore.

I’m using this as an example to hopefully inspire some ideas of your own.

In InfluxDB there are lots of plugins you can install to monitor your Solr, MongoDb etc. I’m going to show how you can easily setup and monitor your Solr instance with InfluxDB.

But the options are endless, you could save the data and present whatever data you want in fancy graphs. For example, you want to collect Sitecore editor data on item events by hooking up to the events pipeline. Or make diagrams of graphs when visitors hit your 404-page.

1. Install InfluxDB

I’m using the Windows Open Source version. Follow the installation guide here.

You need to run the influxd.exe and go to your http://localhost:8086/ (the default port) and there you can set up your organisation, bucket, and user in the interface.

  • Bucket: Think of this like a database. It’s not really but just to get an idea.
  • Organisation: This is your identifier for you influx application
  • Measurement: Think of this like a table.

Here is some glossary for InfluxDB https://docs.influxdata.com/influxdb/v2.2/reference/glossary/

2. Install Telegraf

Telegraf is an open source plugin-driven server agent for collecting and reporting metrics. It enables flexible parsing and serializing for a variety of data formats (such as JSON, CSV) and can serialize the data in InfluxDB. It enables some +300 plugins that you can use with InfluxDB.

Go to 
https://docs.influxdata.com/telegraf/v1.23/install/?t=Windows and download the latest version of telegraf. Follow the installation guide.

3. Setup Telegraf config & Solr Plugin

Go to where you downloaded telegraf and open the telegraf.conf

Start up your influxdb and go to the dashboard, from there go to “Data -> Telegraf -> InfluxDb Output Plugin“.

Copy to clipboard and replace this section in your telegraf.conf file to match your influxDB setup. Generate Token if needed or use your existing one.

Find # [[inputs.solr]] in telegraf.conf and uncomment so your section looks more like this and save.

# # Read stats from one or more Solr servers or cores
 [[inputs.solr]]
#   ## specify a list of one or more Solr servers
   servers = ["http://localhost:8983"]
#
#   ## specify a list of one or more Solr cores (default - all)
   cores = ["main"]
#
#   ## Optional HTTP Basic Auth Credentials
   username = "username"
   password = "pa$$word"

And set the servers, cores and credentials so it matches your solr instance.

As the documentation shows, if you’re installing on windows it needs to be installed as a service.

.\telegraf.exe –service install –config “\telegraf-1.23.0\telegraf.conf”
.\telegraf.exe –service start

You can test your connection with:
.\telegraf.exe –config “<yourPath>\telegraf-1.23.0\telegraf.conf” –test

4. Setup Dashboard in influxDB

Go to Dashboards and create a new Dashboard. Name it then add a cell.

Here I’m adding a query to the “lookups” field on my selected core. Then press top right to save it.

You can set the cell names also.

So with some experimenting I’ve now setup some monitoring for my Solr instance with some simple cells. When you get more knowledge how to work with influxDB you can build and merge cells with different queries to present more valuable data. You could also open up InfluxDB to other users on your server now or setup alerts etc.

Other sources of information

Templates Here you can find community made templates for influxDB like

  • monitoring your Redis Server
  • view data for your MongoDB
  • monitoring your docker containers
  • and many more. Check it out!

Hopefully you found this information useful and inspiring.

Stay tuned for Part 2 where I’ll get into some more in-depth how to write and query to influxDB for Sitecore related data.